
Source: U.S. Census Bureau, U.S. Dept. of Commerce, 2016
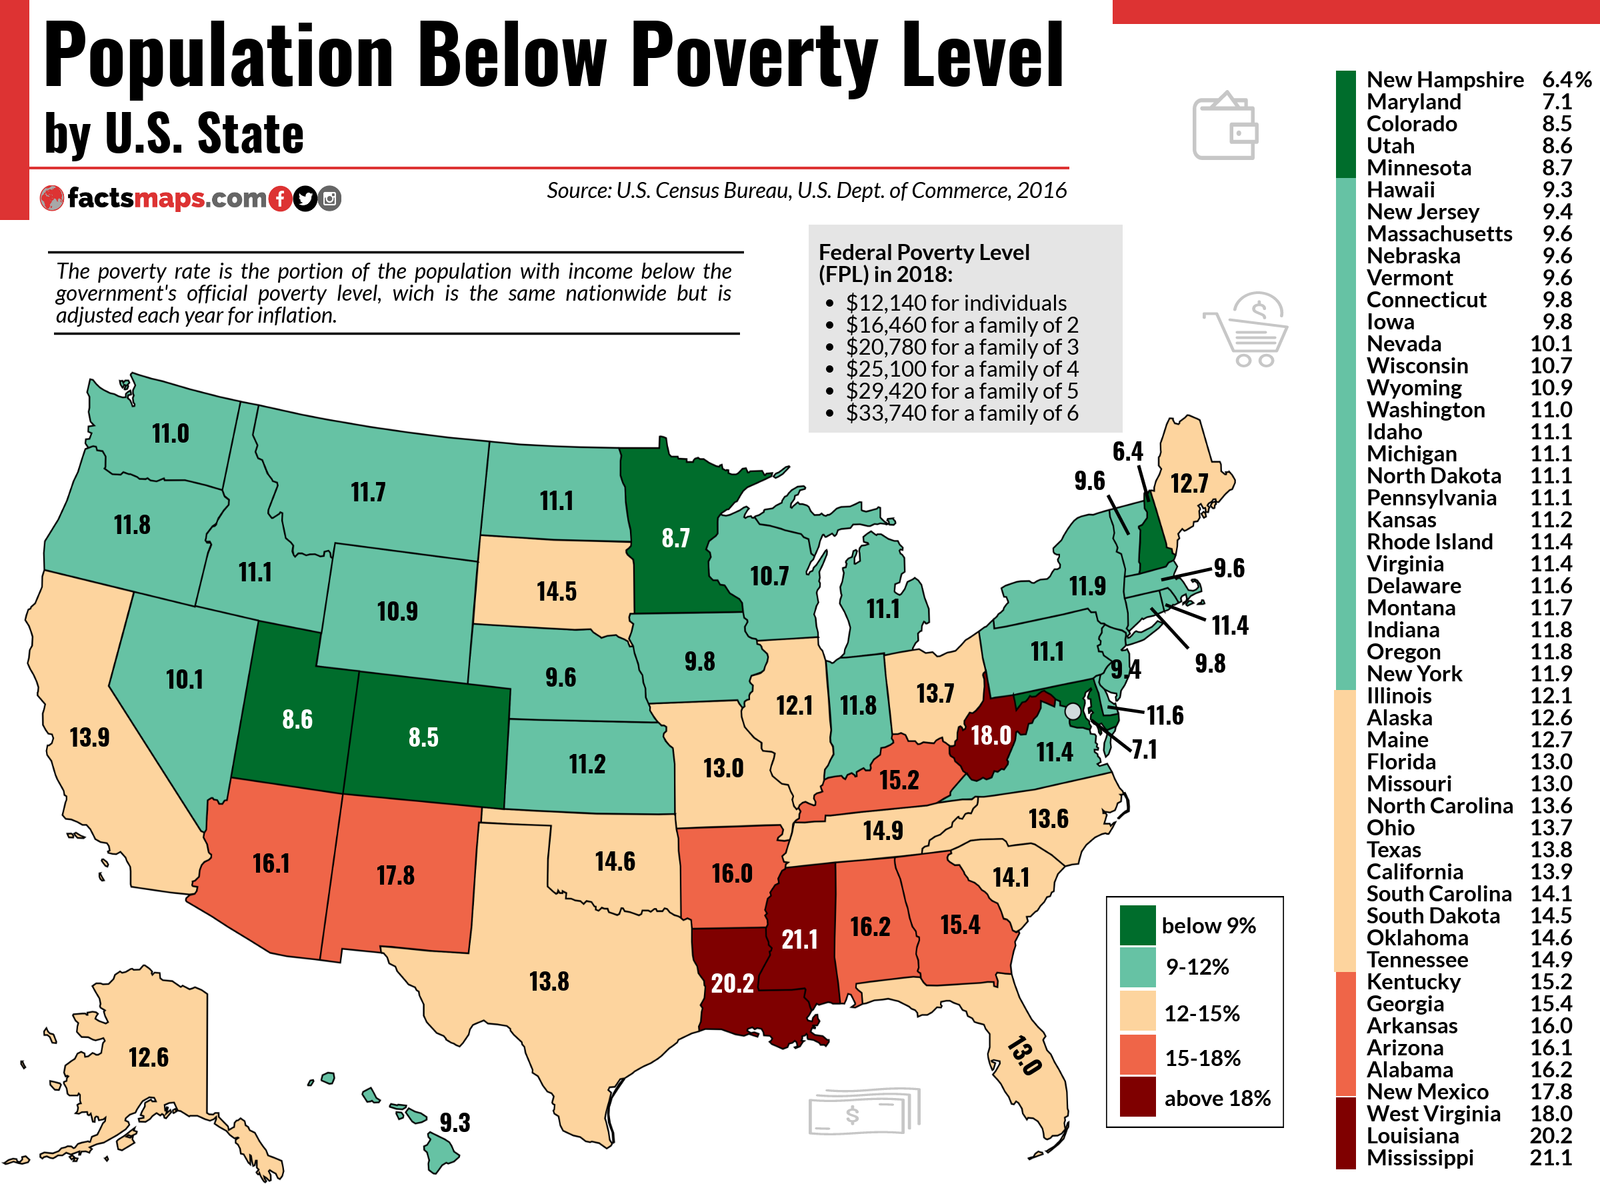
The poverty rate is the portion of the population with income below the government’s official poverty level, which is the same nationwide but is adjusted each year for inflation.
Federal Poverty Level (FPL) in 2018:
- $12,140 for individuals
- $16,460 for a family of 2
- $20,780 for a family of 3
- $25,100 for a family of 4
- $29,420 for a family of 5
- $33,740 for a family of 6
- $38,060 for a family of 7
- $42,380 for a family of 8
- For families/households with more than 8 persons, add $4,320 for each additional person.
Federal Poverty Level by U.S. State in 2016 (%):
| New Hampshire | 6.4 |
| Maryland | 7.1 |
| Colorado | 8.5 |
| Utah | 8.6 |
| Minnesota | 8.7 |
| Hawaii | 9.3 |
| New Jersey | 9.4 |
| Massachusetts | 9.6 |
| Nebraska | 9.6 |
| Vermont | 9.6 |
| Connecticut | 9.8 |
| Iowa | 9.8 |
| Nevada | 10.1 |
| Wisconsin | 10.7 |
| Wyoming | 10.9 |
| Washington | 11.0 |
| Idaho | 11.1 |
| Michigan | 11.1 |
| North Dakota | 11.1 |
| Pennsylvania | 11.1 |
| Kansas | 11.2 |
| Rhode Island | 11.4 |
| Virginia | 11.4 |
| Delaware | 11.6 |
| Montana | 11.7 |
| Indiana | 11.8 |
| Oregon | 11.8 |
| New York | 11.9 |
| Illinois | 12.1 |
| Alaska | 12.6 |
| Maine | 12.7 |
| Florida | 13.0 |
| Missouri | 13.0 |
| North Carolina | 13.6 |
| Ohio | 13.7 |
| Texas | 13.8 |
| California | 13.9 |
| South Carolina | 14.1 |
| South Dakota | 14.5 |
| Oklahoma | 14.6 |
| Tennessee | 14.9 |
| Kentucky | 15.2 |
| Georgia | 15.4 |
| Arkansas | 16.0 |
| Arizona | 16.1 |
| Alabama | 16.2 |
| New Mexico | 17.8 |
| West Virginia | 18.0 |
| Louisiana | 20.2 |
| Mississippi | 21.1 |